Easy to use Image Charts wrapper.
This package was made to replace Quiche.
npm install kish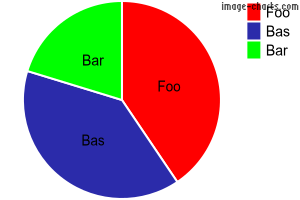
const Kish = require('kish');

const pie = new Kish('pie');
pie.setTransparentBackground(); // Make background transparent
pie.addData(3000, 'Foo', 'FF0000');
pie.addData(2900, 'Bas', '0000FF');
pie.addData(1500, 'Bar', '00FF00');
pie.setLabel(['Foo','Bas','Bar']); // Add labels to pie segments
const imageUrl = pie.getUrl(true); // First param controls http vs. https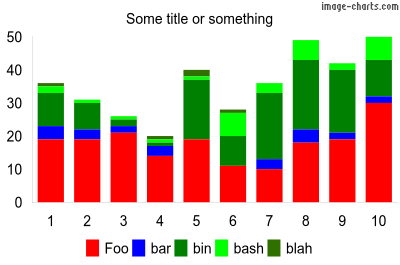
const Kish = require('kish');

const bar = new Kish('bar');
bar.setWidth(400);
bar.setHeight(265);
bar.setTitle('Some title or something');
bar.setBarStacked(); // Stacked chart
bar.setBarWidth(0);
bar.setBarSpacing(6); // 6 pixles between bars/groups
bar.setLegendBottom(); // Put legend at bottom
bar.setTransparentBackground(); // Make background transparent

bar.addData([19, 19, 21, 14, 19, 11, 10, 18, 19, 30], 'Foo', 'FF0000');
bar.addData([4, 3, 2, 3, 0, 0, 3, 4, 2, 2], 'bar', '0000FF');
bar.addData([10, 8, 2, 1, 18, 9, 20, 21, 19, 11], 'bin', '008000');
bar.addData([2, 1, 1, 1, 1, 7, 3, 6, 2, 7], 'bash', '00FF00');
bar.addData([1, 0, 0, 1, 2, 1, 0, 0, 0, 0], 'blah', '307000');

bar.setAutoScaling(); // Auto scale y axis
bar.addAxisLabels('x', ['1', '2', '3', '4', '5', '6', '7', '8', '9', '10']);

const imageUrl = bar.getUrl(true); // First param controls http vs. https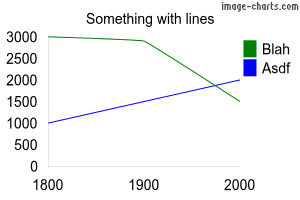
const Kish = require('kish');

const chart = new Kish('line');
chart.setTitle('Something with lines');
chart.addData([3000, 2900, 1500], 'Blah', '008000');
chart.addData([1000, 1500, 2000], 'Asdf', '0000FF');
chart.addAxisLabels('x', ['1800', '1900', '2000']);
chart.setAutoScaling();
chart.setAxisRange('y', 500, 3500, 250);
chart.setTransparentBackground();

const imageUrl = chart.getUrl(true); // First param controls http vs. https
const Kish = require('kish');

const qr = new Kish('qr');
qr.setLabel('https://github.com/otnc/kish');
qr.setWidth(100);
qr.setHeight(100);

const url = qr.getUrl(true); // First param controls http vs. https-
line
-
pie
-
bar
-
qr
-
chart.setWidth(width [number]); -
chart.setHeight(height [number]); -
chart.setTitle(title [string]); -
chart.setTitleColor(color [hex color]); -
chart.setTitleSize(size [number]); -
chart.setTitleRight(); -
chart.setTitleLeft(); -
chart.setLegendOrder(order [string]) -
chart.setLegendLeft(); -
chart.setLegendRight(); -
chart.setLegendBottom(); -
chart.setLegendTop(); -
chart.setLegendVertical(); -
chart.setLegendHorizontal(); -
chart.setLegendHidden(); -
chart.setLegendSize([number]); -
chart.setTransparentBackground(); -
chart.addAxisLabels(axis [x | y | r], labels [array]); -
chart.addData(data [number | array], label [string], color [hex color]); -
chart.setAutoScaling(); -
chart.setHostname(hostname [string]); -
chart.getUrl(https [boolean]);// true = https, false = http -
chart.getReq(https [boolean], callback [function]); -
chart.getPostReq(https [boolean], callback [function]);
-
pie.set3D(); -
pie.setLabel(); -
pie.addPercent();
-
bar.addData(); -
bar.setBarWidth([number]); -
bar.setBarSpacing([number]); -
bar.setBarVertical(); -
bar.setBarHorizontal(); -
bar.setBarGrouped(); -
bar.setBarStacked(); -
bar.setBarOverlapped(); -
bar.setAxisRange(axis ["x", "r", "y"], start [number], end [number], step [number]);
-
line.addData(data [number | array], label [string], color [hex color], thickness [number], line length [number], space length [number]); -
line.setSparklines(); -
line.setXY(); -
line.setAxisRange(axis ["x", "r", "y"], start [number], end [number], step [number]);
-
qr.setLabel(data [string]); -
qr.setEncoding(encoding [UTF-8 | Shift_JS | ISO-8859-1]); -
qr.setErrorCorrectionLevel(level [string]) -
qr.setMargin(margin [number]);// Margin around graphic -
qr.setWidth(width [number]); -
qr.setHeight(height [number]); -
qr.getUrl(https [boolean]);// true = https, false = http
-
Pie charts
-
Bar charts
-
Auto scaling